
AI Curiosities
Estimate of Matterport 3D Virtual Tour Implementation for American Representational Art Exhibits in U.S. Museums (2020-2024)
by Gemini 2.5 Pro, August, 2025
I. The Digital Imperative: Immersive Technology in the Cultural Sector
The period between 2020 and 2024 witnessed a profound transformation in how cultural institutions engage with their audiences, driven by a confluence of technological maturation and unprecedented external pressures. At the heart of this shift lies the rapid expansion of the virtual tour market, which evolved from a niche offering into a strategic necessity for a wide range of industries, most notably tourism and hospitality. Understanding the scale and dynamics of this broader market is essential to contextualizing its specific application within the American art museum sector.
1.1. Macroeconomic Landscape of the Global Virtual Tour Market
The global virtual tour market is experiencing a period of explosive growth, indicative of a fundamental shift in how businesses and consumers interact with physical spaces in a digital context. The market was valued at $1,219.1 million in 2023 and is projected to reach an extraordinary $15,923.0 million by 2034, expanding at a Compound Annual Growth Rate (CAGR) of 29.3%. A parallel analysis projects the market will hit nearly $18 billion by 2035, with a CAGR of 28%.This robust growth trajectory establishes immersive digital experiences not as a fleeting trend, but as a durable and expanding economic sector.
Geographically, North America stands as the dominant market, capturing a 35.7% share in 2024 with revenues of $435.2 million. This leadership position is attributed to the region's advanced technological infrastructure and high degree of digital literacy among its population, creating a fertile ground for the adoption of sophisticated digital platforms. This geographical concentration is of paramount importance to this analysis, as it aligns directly with the query's focus on American museums and confirms a mature market receptive to such technologies.
The primary engine of this growth is the Tourism and Hospitality segment, which held a dominant market share of over 38.8% in 2024. Museums, as cornerstones of the cultural tourism economy, are a natural component of this segment. The demand for immersive travel experiences has driven widespread adoption, with potential visitors increasingly seeking virtual previews of destinations and attractions to inform their travel planning.
1.2. Consumer Behavior and the Value Proposition of Immersive Experiences
The expansion of the virtual tour market is propelled by strong consumer demand and demonstrable returns on investment for the businesses that implement them. A global study found that 73% of participants expressed satisfaction with their virtual event experiences, indicating high consumer approval for digital formats. This demand is active rather than passive, with 67% of consumers stating a desire for more businesses to offer virtual tours.
The scale of this consumer behavior is significant, with daily global visits to virtual tours exceeding 5 million. This technology has become a key part of the consumer decision-making process, with 50% of internet users utilizing virtual tours to inform their choices. The business impact is tangible and quantifiable. Websites featuring virtual tours see user engagement that is 5 to 10 times higher than those without, and businesses across various sectors report increases in bookings and conversion ratios ranging from 16% to 67%. For cultural institutions, this "conversion" can be interpreted as a range of valuable outcomes, including pre-booking tickets for physical visits, purchasing memberships, donating, or simply achieving deeper engagement with educational content, thereby fulfilling their public mission. The expectation for high-fidelity digital previews, long established in real estate, has now fully permeated the cultural and tourism sectors. Museums are no longer just competing with other local attractions for physical foot traffic; they are also competing for a share of the millions of daily virtual tour visits that represent a global pool of potential audience members.
1.3. Technological Evolution: From Static Galleries to Interactive Digital Twins
The definition of a "virtual tour" has evolved dramatically, moving far beyond simple 360-degree photographs or pre-recorded video walkthroughs. The contemporary landscape, particularly in 2024, is characterized by the creation of high-fidelity "digital twins"-dimensionally accurate 3D models of physical spaces that serve as a platform for a host of interactive features. This technological leap is central to understanding why a premium platform like Matterport holds a distinct value proposition for museums.
Key technological trends that define the modern virtual museum experience include:
·
This technological sophistication signifies that the strategic value of a virtual tour has moved beyond mere replication of the physical space. The most advanced digital experiences offer an enhancement of the in-person visit, providing layers of context, interactivity, and accessibility that are not possible within the constraints of a traditional gallery. This transforms the digital tour from a simple marketing tool into a new and powerful curatorial and educational platform in its own right.
II. A Sector Transformed: The Acceleration of Digital Engagement in American Art Museums (2020-2024)
The five-year period from 2020 to 2024 represents the most rapid and fundamental digital transformation in the history of the American museum sector. While digital initiatives existed prior to 2020, the COVID-19 pandemic served as a critical inflection point, acting as an unprecedented catalyst that elevated digital engagement from a peripheral activity to a core strategic imperative for survival and relevance.
2.1. The Pandemic as an Unprecedented Catalyst
In December 2019 and the early months of 2020, the closure of public spaces compelled museums to fundamentally reimagine their relationship with their audiences. With physical attendance dropping to an average of 35% of pre-pandemic levels, digital engagement became, for a time, "the only option" for institutions to fulfill their missions. This crisis precipitated a dramatic and immediate pivot to virtual formats across the entire cultural landscape. The scale of this shift is captured by a Forbes report noting a 1,000% increase in virtual events in 2020 alone.
Museums of all sizes and disciplines responded with urgency, launching a variety of digital initiatives to maintain audience connection. Major institutions like the Smithsonian and the Guggenheim, along with over 1,000 other museums globally, began offering virtual tours of their galleries. The public response was enormous, with search terms like "virtual field trip" and "virtual museum tours" becoming some of the most popular queries in 2020, signaling a strong public appetite for connecting with cultural institutions remotely.
2.2. Quantifying the Digital Pivot: Adoption Rates and Program Types
This widespread adoption of digital programming was not limited to a few forward-thinking institutions; it was a sector-wide phenomenon. The most definitive data point on this trend comes from a 2021 study by Cuseum, which surveyed over 500 museum professionals. The study found that an overwhelming 92% of respondents reported that their institution offered some form of digital programming. The report specifically noted that virtual tours were a significant component of this digital push, "especially amongst art museums," a finding that is directly relevant to this analysis.
This high adoption rate encompassed a broad spectrum of digital content, confirming that the move to virtual tours was part of a larger, well-resourced strategic effort. Museums created everything from online quizzes and TikTok accounts to podcasts, live-streamed animal encounters, and, most prominently, virtual field trips and 3D tours of their collections and special exhibitions.
While the 92% adoption figure is nearly universal, it represents a wide variance in the quality, complexity, and cost of the digital programs deployed. The pandemic created a "digital mandate" for all museums, but institutional budget, staff capacity, and strategic vision dictated the level of execution. Larger, more financially secure institutions were better positioned to invest in premium, high-fidelity 3D platforms like Matterport, which require specialized equipment and processing fees. Smaller museums, conversely, were more likely to have opted for lower-cost alternatives, such as simple video walkthroughs or interactive websites built from 2D photographs. This disparity in technological capability is a critical variable that must be accounted for in any realistic estimation model.
2.3. The "New Normal": From Temporary Fix to Permanent Strategy
The digital infrastructure and programming developed during the pandemic were not dismantled as museums reopened their physical doors. Instead, they have become a permanent and integrated part of institutional strategy. Industry observers noted that "most, if not all, of these virtual additions are here to stay". This permanence is driven by the clear benefits that were realized during the crisis. Digital engagement was proven to dramatically increase a museum's reach beyond its immediate geographic community, welcome distant visitors, and improve accessibility for audiences who may face physical, financial, or other barriers to an in-person visit.
This strategic shift is reflected in a 2024 industry perspective which concluded that virtual tours are "not just a temporary solution for museum engagement but a pivotal part of the future of cultural exploration and education". The crisis-driven necessity of 2020 evolved into a recognized strategic opportunity by 2024.
An important, and perhaps initially unintended, consequence of this rapid digitization is the creation of a vast, publicly accessible archive of ephemeral exhibitions. In the past, a temporary exhibition, once dismantled, would exist only in catalogs and photographs. A high-fidelity digital twin, however, preserves the complete curatorial experience-the specific arrangement of objects, the wall texts, the lighting, and the flow of the gallery-in perpetuity. This has profound long-term implications for art historical research, collection management, and the very definition of an "exhibition," providing a powerful, ongoing return on the initial investment in digitization.
III. Matterport's Niche: Platform, Partnerships, and Cultural Sector Penetration
Within the burgeoning virtual tour market, Matterport, Inc. has carved out a distinct and premium niche. The company's success, particularly within the cultural heritage sector, is attributable not only to its core technology but also to a sophisticated, partner-driven ecosystem that extends its reach and capabilities. To estimate the number of Matterport tours in American art museums, it is first necessary to understand the platform's specific value proposition and its documented penetration into this market.
3.1. The Matterport Value Proposition: Beyond the Tour, the Digital Twin
Matterport's primary differentiator is its focus on creating "digital twins" rather than simply "virtual tours". While a basic tour might consist of stitched-together panoramic photos, a Matterport digital twin is a dimensionally accurate 3D model of a space, captured using specialized cameras like the Matterport Pro2 that combine high-resolution imagery with infrared depth-scanning technology. This process results in a highly realistic and immersive user experience, allowing for smooth navigation through a 3D "dollhouse" view of the entire space.
For a museum, this technological fidelity offers several advantages over simpler platforms. The high-quality visuals do justice to the artworks on display, and the underlying spatial data can be used for practical applications such as exhibition planning, facilities management, and security logistics. The ability to embed rich media content-such as high-resolution detail shots, video commentary, and links to collection databases-directly into the 3D model via "Mattertags" allows curators to create a deeply layered educational experience.
3.2. The Ecosystem Multiplier: How Partnerships Drive Adoption
Matterport's go-to-market strategy relies heavily on a global network of third-party developers and service providers who use Matterport's Application Programming Interfaces (APIs) and Software Development Kits (SDKs) to build customized solutions for specific industries. This ecosystem model is a significant competitive advantage in the cultural sector, as it allows the core technology to be adapted for highly specific use cases without Matterport needing to develop the niche expertise itself. This makes the platform more versatile and scalable for institutions with diverse goals. Key partners targeting the cultural and tourism sectors include:
The existence of this partner-led ecosystem suggests that the total number of Matterport tours in the museum sector is likely significantly higher than what is publicly featured in Matterport's own corporate marketing materials. Partners like MPskin operate as independent businesses serving their own client bases, representing a vast, semi-visible market that must be factored into any credible estimate.
3.3. Proof of Concept: Documented Use in American Art Museums
Concrete evidence confirms that Matterport's platform has been successfully adopted by American art museums, providing a solid foundation for the estimation model. Documented examples include:
These specific, verifiable instances of adoption by museums focused on American art provide the critical proof-of-concept that anchors the subsequent quantitative analysis.
IV. Framework for Estimation: Quantifying the Addressable Market
To develop a credible estimate, it is necessary to first define and quantify the total addressable market (TAM). This involves moving from the entire universe of U.S. museums to a refined subset of institutions that are relevant based on their subject matter focus and financial capacity. This framework provides the foundational dataset upon which the adoption model will be built.
4.1. Defining the Total Universe of American Art Museums
The analysis begins with a precise, verifiable figure for the total number of art museums in the United States. According to data from CauseIQ, there are 1,111 art museums in the country. This figure is distinct from the broader estimate of 35,000 total museums of all types (including historical societies, science centers, etc.) provided by the Institute of Museum and Library Services, and its specificity allows for a more targeted analysis. These 1,111 institutions constitute the initial TAM.
4.2. Segmentation by Financial Capacity
The capacity of a museum to invest in premium digital technologies like Matterport is strongly correlated with its annual revenue. Therefore, the 1,111 museums are segmented into the revenue tiers provided by CauseIQ, which serves as the most effective available proxy for budget, staffing, and technological sophistication. The distribution is as follows:
The remaining 292 of the 1,111 museums have undisclosed revenue data. For the purposes of this model, these will be proportionally distributed across the known tiers, as their exclusion would lead to an underestimation of the market.
4.3. Filtering for Subject Matter: American Representational Art
The query specifies a focus on "American representational art." Not all 1,111 art museums have this as a primary or significant part of their collection. Therefore, a critical assumption must be made to filter the TAM down to a "Relevant Addressable Market." This is achieved by applying an estimated percentage to each revenue tier, representing the likelihood that a museum in that tier has a substantial collection and exhibition program dedicated to this genre.
The justification for these percentages is based on qualitative analysis of the collections of prominent American museums. Larger, encyclopedic institutions (Tiers 1-2), such as the Metropolitan Museum of Art or the Art Institute of Chicago, almost invariably have significant American art wings. Mid-size museums often have a strong American focus, like the High Museum of Art or the New Britain Museum of American Art. Smaller museums are more likely to be highly specialized, so the probability of a focus on this specific genre is lower unless it is their sole mission (e.g., a museum dedicated to a single American artist).
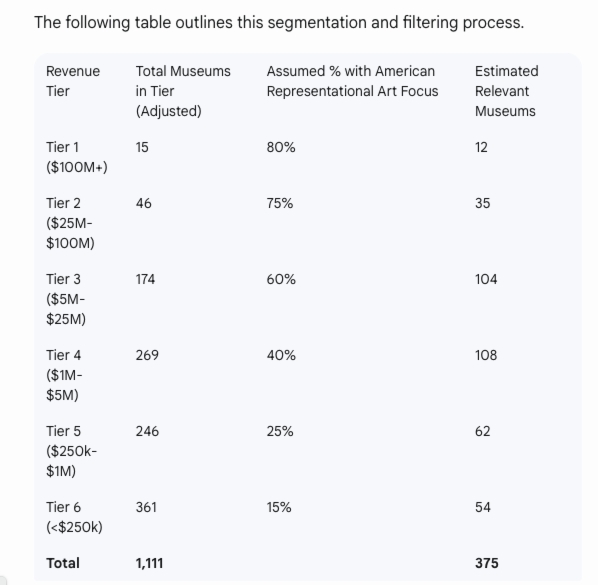
Note: The "Total Museums in Tier (Adjusted)" column reflects the proportional distribution of the 292 museums with undisclosed revenue data across the six established tiers.
This framework reduces the initial universe of 1,111 art museums to an estimated 375 relevant institutions that are most likely to have presented exhibitions of American representational art during the 2020-2024 period. This refined figure provides a much more realistic basis for estimating the adoption of a specific technology for a specific purpose.
V. Deriving the Estimate: A Model of Technology Adoption and Implementation
Building upon the framework of 375 relevant institutions, the final step is to model the adoption of Matterport's specific technology and the volume of tours created. This process involves a second set of reasoned assumptions regarding platform adoption rates and the average number of exhibitions digitized per institution over the five-year period. The result is a multi-layered calculation that yields a central estimate for the total number of tours.
5.1. Modeling Matterport Adoption Rates (2020-2024)
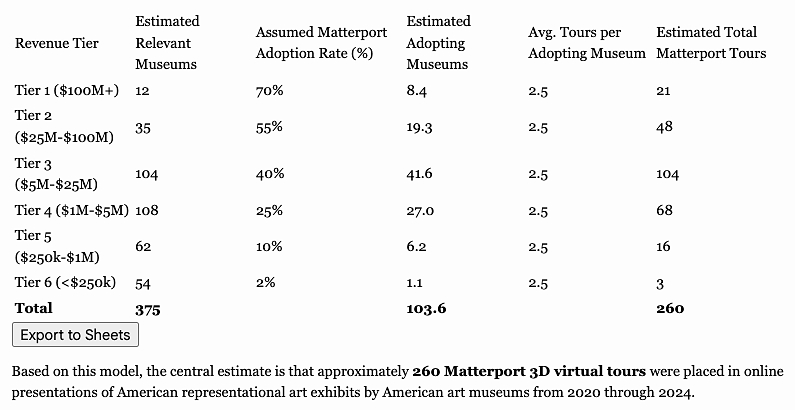
While the Cuseum study indicated a near-universal 92% adoption rate for some form of digital programming, the rate for a specific, premium platform like Matterport would necessarily be lower. The likelihood of an institution investing in Matterport is directly tied to its financial capacity and strategic ambition. Therefore, a tiered adoption rate is applied to the relevant museums in each revenue segment.
The justification for these rates is as follows: Top-tier institutions, with large budgets and a need to maintain a reputation for technological leadership, would have a very high propensity to adopt best-in-class solutions. Mid-tier institutions would also see significant adoption, spurred by the need to remain competitive and enabled by the accessibility provided by Matterport's partner ecosystem. Adoption rates would then taper off sharply for smaller museums with limited budgets and technical staff. The assumed average adoption rates for the 2020-2024 period are:
These percentages reflect a high penetration at the top of the market and a more selective adoption pattern further down the financial ladder.
5.2. Estimating Tour Volume per Institution
An adopting museum would not necessarily create only one virtual tour. Institutions frequently create digital twins for both their permanent collection galleries and for major temporary or special exhibitions. A large museum might reasonably host three to five significant temporary exhibitions relevant to American representational art over a five-year period, in addition to digitizing its permanent American wing. Smaller institutions might only digitize their primary collection once.
To account for this variability, a blended average of 2.5 unique Matterport exhibition tours per adopting institution is assumed for the 2020-2024 period. This figure represents a balance between museums creating a single tour and those creating multiple tours for various exhibitions.
5.3. Final Calculation and Estimate
The final estimate is derived by multiplying the number of relevant museums in each tier by the assumed Matterport adoption rate for that tier, and then multiplying that result by the average number of tours per institution. The following table presents this calculation in full.
Based on this model, the central estimate is that approximately 260 Matterport 3D virtual tours were placed in online presentations of American representational art exhibits by American art museums from 2020 through 2024.
VI. Beyond the Numbers: Strategic Implications and Future Outlook
The quantitative estimate of 260 tours provides a snapshot of market penetration, but the true significance of this trend lies in the strategic calculus behind digitization and the long-term value these digital assets represent. The adoption of Matterport and similar technologies is not merely a technical upgrade but a strategic evolution in how museums conceive of their collections, exhibitions, and audiences.
6.1. The Strategic Calculus of Digitization: Permanent vs. Temporary Exhibitions
The decision of what to digitize reveals key institutional priorities. The creation of a virtual tour for a permanent collection, as seen with the Kimbell Art Museum, establishes an "evergreen" digital flagship for the institution. This asset serves as a primary point of entry for global audiences, a resource for educators, and a persistent marketing tool that showcases the museum's core identity.
Conversely, the digitization of temporary or special exhibitions, such as the "Prix de West" show at the National Cowboy & Western Heritage Museum or the many special exhibitions at the Kimbell, serves a different strategic purpose.These tours extend the life and impact of a costly and time-limited curatorial endeavor. They allow the exhibition to reach audiences who could not travel to see it during its physical run and, as previously noted, create a permanent archival record of the event. For "blockbuster" shows, a virtual tour can also serve as a powerful promotional tool, driving physical ticket sales by offering an enticing preview.
6.2. The Digital Twin as a Perpetual Asset
Unlike a temporary marketing campaign, a Matterport digital twin is a perpetual asset that can be repurposed and redeployed for numerous applications long after its initial creation. This dramatically alters the return-on-investment calculation for museums. Key long-term value propositions include:
6.3. The Next Frontier: AR, AI, and V-Commerce in the Virtual Gallery
The technology underlying these virtual tours is not static. The period from 2020 to 2024 laid the foundation for the next wave of innovation in digital museum experiences. The future outlook points toward a deeper integration of complementary technologies that will transform the digital twin from an object of observation into a platform for dynamic interaction.
Future trends will likely include:
VII. Conclusion and Strategic Recommendations
The period from 2020 to 2024 marked a definitive shift in the digital landscape for American art museums. Propelled by the necessity of the COVID-19 pandemic and enabled by the maturation of immersive technologies, the creation of 3D virtual tours transitioned from a novelty to a core component of institutional strategy. The Matterport platform, with its high-fidelity digital twin technology and robust partner ecosystem, established itself as a leading solution in this space.
7.1. Final Estimate and Confidence Intervals
The analytical model developed in this report, which segments the 1,111 U.S. art museums by financial capacity, filters for relevance to American representational art, and applies tiered adoption rates, leads to a central estimate of 260 Matterport 3D virtual tours created for this specific purpose between January 1, 2020, and December 31, 2024.
It is critical to recognize that this figure is a model-derived estimate, not an absolute census. Its accuracy is dependent on the validity of the core assumptions made regarding collection focus and technology adoption rates. Therefore, this central estimate is best understood within a confidence interval. Given the variables involved, a 90% confidence interval of 210 to 310 tours is a reasonable range. This range acknowledges the potential for variation in the underlying assumptions while affirming the central estimate as the most probable outcome based on the available evidence. The key variables influencing this figure are the assumed Matterport adoption rate for mid-tier museums (Tiers 3 and 4) and the average number of tours created per institution.
7.2. Recommendations for Museum Stakeholders
For directors, curators, and trustees of art museums, the findings of this report suggest several strategic actions:
1. Reframe Digital Investment: Cease viewing the creation of virtual tours as a short-term marketing or IT expense. Instead, frame it as a long-term capital investment in a perpetual institutional asset that has applications in education, accessibility, archival preservation, and collections management.
2. Leverage the Partner Ecosystem: Recognize that the full potential of a digital twin platform is often unlocked by specialized third-party developers. Engage with this ecosystem to access expertise in areas like AR, V-commerce, and educational content development without the need to build large, expensive in-house technical teams.
3. Develop a Holistic Digital Strategy: A virtual tour should not be a standalone product. It should be integrated into a broader digital strategy that connects it with online collections databases, educational curricula, membership drives, and e-commerce initiatives to maximize its value and impact across all departments of the museum.
7.3. Recommendations for Technology Vendors and Investors
For technology providers like Matterport, its partners, and investors in the art-tech space, this analysis highlights key market characteristics and opportunities:
1. Embrace Market Segmentation: The American art museum market is not monolithic. A highly segmented approach is required, with high-touch, enterprise-level solutions targeted at the well-funded top-tier institutions, and more scalable, partner-driven solutions aimed at the large but fragmented mid-tier.
2. Cultivate the Ecosystem: The partner network is the most effective and scalable channel for penetrating the museum market. Continued investment in robust APIs, SDKs, and partner support programs is critical for long-term growth and for driving innovation in niche applications.
3. Tailor the Value Proposition: Marketing and product development should focus on the specific long-term needs of the cultural heritage sector. Emphasize use cases related to education, global accessibility, and the permanent archival of temporary exhibitions, as these are the value propositions that resonate most strongly with the mission-driven nature of these institutions.
About us:
 Tens of thousands of individuals,
including students, scholars, teachers and others, view educational and
informative materials every month on our site, which is structured as a
digital library.
Tens of thousands of individuals,
including students, scholars, teachers and others, view educational and
informative materials every month on our site, which is structured as a
digital library.
 Return to AI Curiosities
Return
to Research Projects, Reports and Studies
Links to sources of information outside of our web site are provided only as referrals for your further consideration. Please use due diligence in judging the quality of information contained in these and all other web sites. Information from linked sources may be inaccurate or out of date. TFAO neither recommends or endorses these referenced organizations. Although TFAO includes links to other web sites, it takes no responsibility for the content or information contained on those other sites, nor exerts any editorial or other control over them. For more information on evaluating web pages see TFAO's General Resources section in Online Resources for Collectors and Students of Art History.
Copyright 2025 Traditional Fine Arts Organization, Inc. an Arizona nonprofit corporation. All rights reserved.